

How To Draw A Scale Bar For Biological Drawings
I recently saw drawings by Maria Sybilla Merian at Kupferstichkabinett Berlin and the University Library Dresden. Merian, who lived from 1647 to 1717, is renowned for her exceptional illustrations of biological specimens and gained recognition as a scientist for her nature observations, for example, of insect metamorphosis.
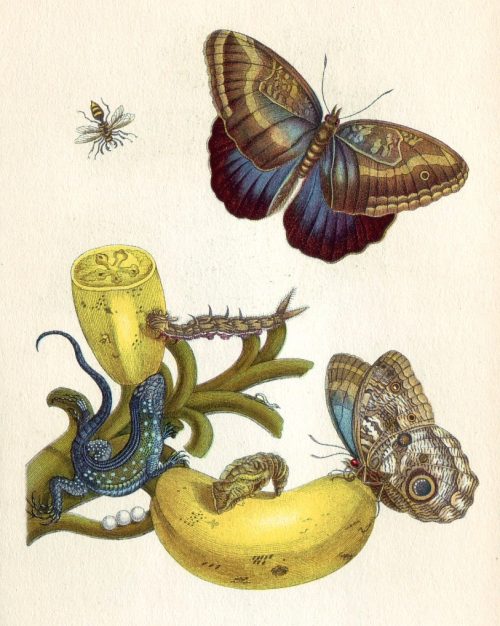
Merian evidently was genius in choosing frame and magnification in her drawings, but her pictures lack indications of scale*, which are essential in today's science images. Scales give the reader the key for aligning the image content with reality. To my knowledge, neither Merian nor her predecessors from Antiquity, Byzantium, or Renaissance included scales in their medical and natural science images*. Even in the beginning of the 20th century, images were often considered a waste of space and scales unnecessary as scientists were familiar with each other's apparatuses and objects. Today however we study invisible processes and structures that are unfamiliar to most of our colleagues and therefore have to include scales in our images.
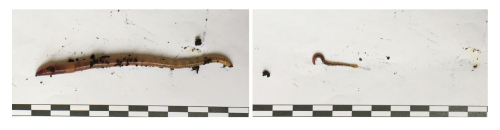
We often include in images a familiar object of a standard size for scale: a penny placed on a rock, a person standing beside a large animal or in a landscape, a measuring tape next to a fossil (or an Earth worm!).
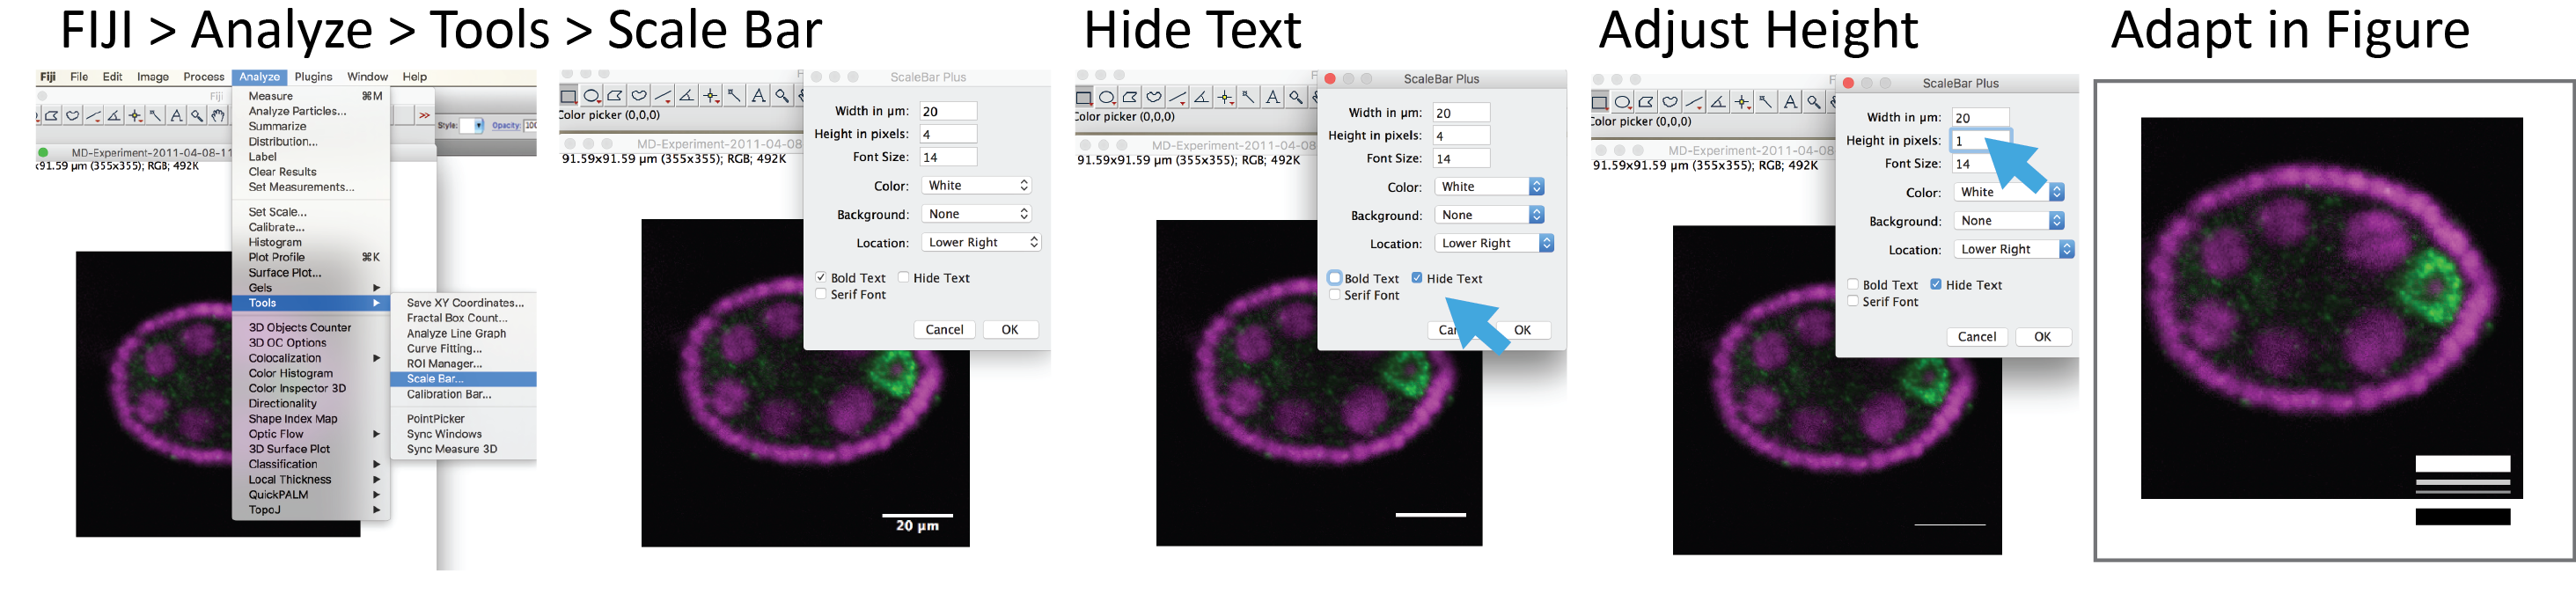
Using familiar objects for scale isn't possible for tiny things. We don't have a clear mental image of the size of a salt grain or sesames seed to reliably use them to scale for instance cells**. We therefore include scale bars in microscopy images. With ImageJ/FIJI files from any microscope system can be read in along with their scaling information (shout-out to Curtis and Melissa and the Bio-Formats project!). By using Analyze > Tools > Scale Bar we can add the scale bar with a user-defined length, width, color, position, and label. Now the audience can calculate the actual size of objects and relate image with reality.
Four tips for superb scale bars
- Length: Be kind to your audience and use simple units, such as 100um, 50um, 10 or 2um.
- Color: Scale bars should have a high contrast with the background. Avoid red, green, or blue bars, as these colors might be considered part of the image.
- Position: Lower left corner is a safe place. The upper space should be kept for important information like species, cell type, or gene name.
- Add scale bar last: In the process of writing your manuscript you may re-think the figure size. Also images are re-sized for posters and slides. It is therefore easierst to add only a very fine scale bar with FIJI and then re-draw it in Adobe Illustrator (or PowerPoint, as I I know that about half of you out there use PowerPoint for making figures and posters!).
And finally, do not miss this article by Monica Zoppe with an interesting idea on how to communicate subcellular sclales better!
* I'd be delighted to stand corrected, and if you find old scientific images with scale bars, or interesting scales, send them my way for my collection!
** a great tool to update yourself in comparable scales in biology is here: http://learn.genetics.utah.edu/content/cells/scale/.
I never cease to be amazed at the relative size differences of cells and how they vary over so many magnitudes!

 (4 votes)
![]() Loading...
Loading...
How To Draw A Scale Bar For Biological Drawings
Source: https://thenode.biologists.com/scales-scientific-images/resources/
Posted by: whitesidewheark.blogspot.com
0 Response to "How To Draw A Scale Bar For Biological Drawings"
Post a Comment